Statistics Summary
                                            On the right side of the Customers Statistics page, the Statistics Summary pane is displayed.


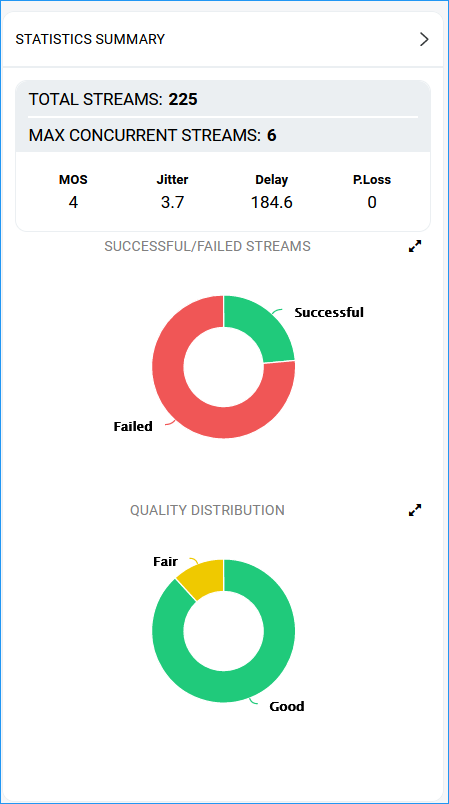
                                            This pane displays the following:


                                                     | 
                                                    ■
                                                     | 
                                                    The total # of calls made over devices in the time period | 


                                                     | 
                                                    ■
                                                     | 
                                                    The maximum concurrent calls measured over devices in the time period | 


                                                     | 
                                                    ■
                                                     | 
                                                    The values of MOS, Jitter, Delay and Packet Loss quality metrics measured over devices in the time period | 


                                                     | 
                                                    ■
                                                     | 
                                                    The pane also displays two metrics as pie charts: | 


                                                     | 
                                                    ●
                                                     | 
                                                    Successful/Failed Calls pie chart. Point yourmouseover a segment of the color-codedpie chart to determine the # and % of calls that wereevaluatedas Successful orFailed in that time interval. | 


                                                     | 
                                                    ●
                                                     | 
                                                    Quality Distribution pie chart. Point your mouse over a segment of the color-coded pie chart to determine the # and % of calls whose voice quality scored Good Fair or Poor in that time interval. |